Day 79 - Exploring Prometheus Monitoring! 📈

Hey there, fellow learners! Today, let's dive into the world of Prometheus, an incredible open-source system designed for monitoring services and generating alerts based on a time series data model. 🚀
Task 1: Understanding Prometheus Architecture Prometheus operates on a decentralized architecture, consisting of a server that collects and stores time series data, along with various client applications that expose metrics. This setup allows for efficient and scalable monitoring across different services.
Task 2: Exploring Prometheus Features Prometheus comes packed with a plethora of features to supercharge your monitoring capabilities. From powerful querying and alerting functionalities to seamless integration with Grafana for visualization, Prometheus has it all.
Task 3: Delving into Prometheus Components At its core, Prometheus comprises several essential components, including the Prometheus server responsible for data scraping and storage, exporters for exposing metrics from third-party systems, and alertmanager for managing alerts efficiently.
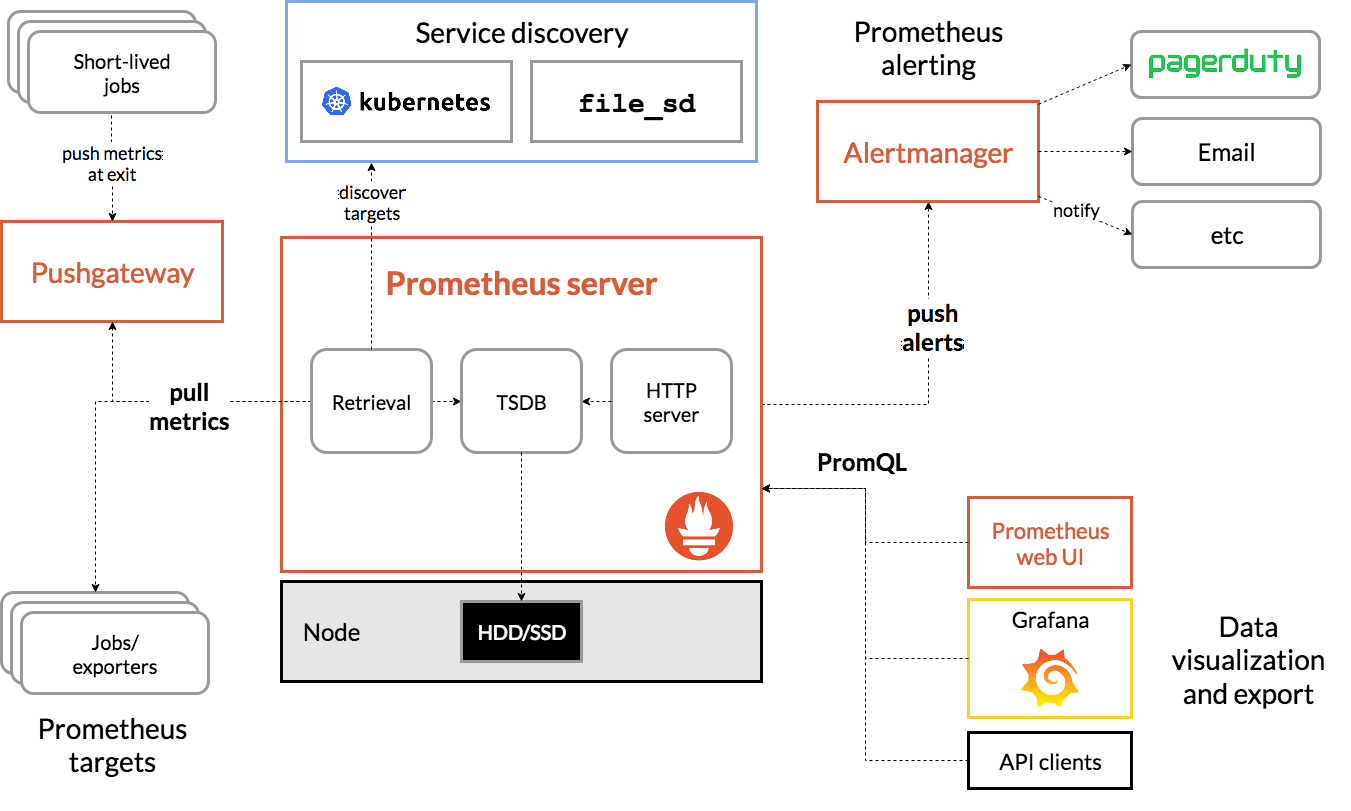
Task 4: Unveiling the Database Behind Prometheus Prometheus leverages its custom time-series database, which is optimized for high performance and efficient storage of metric data. This database plays a crucial role in enabling Prometheus to handle vast amounts of time series data effectively.
Task 5: Understanding Default Data Retention By default, Prometheus retains data for a specific period, typically around 15 days. However, this retention period can be adjusted based on your specific monitoring requirements, ensuring that you have access to historical data when needed.
With these foundational insights into Prometheus, you're well-equipped to harness its full potential and revolutionize your monitoring strategy. Stay tuned for more exciting discoveries ahead! 🔍🌟 #Prometheus #Monitoring #DataAnalytics #OpenSource #TechExploration


