Day 77: Alerting with Grafana 🚨

Welcome back! Today, let's delve into the powerful world of Grafana Alerting. Whether you're managing a small project or a large-scale system, being notified of issues in real-time is crucial for maintaining smooth operations. Let's get started!
Understanding Grafana Alerting
Grafana Alerting empowers you to detect and respond to problems in your systems promptly. It provides a centralized platform to create, manage, and act upon alerts efficiently, ensuring that your team can address issues swiftly.
Setting Up Grafana Cloud
Sign Up for Grafana Cloud: Head over to the Grafana website and sign up for Grafana Cloud. Follow the on-screen instructions to create your account.
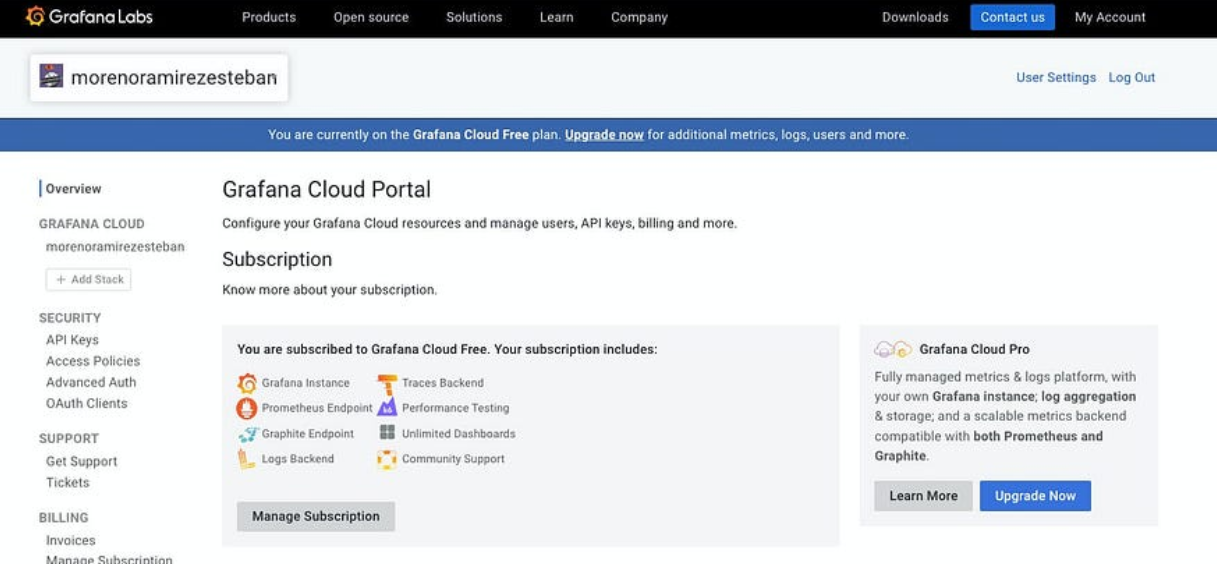
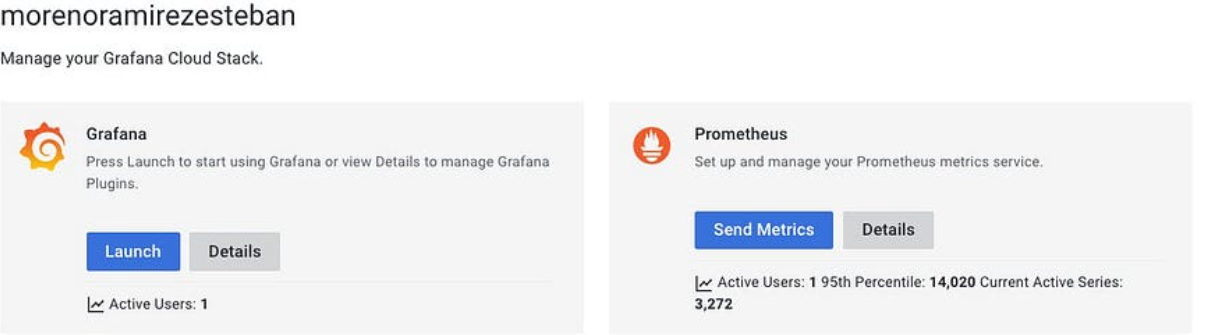
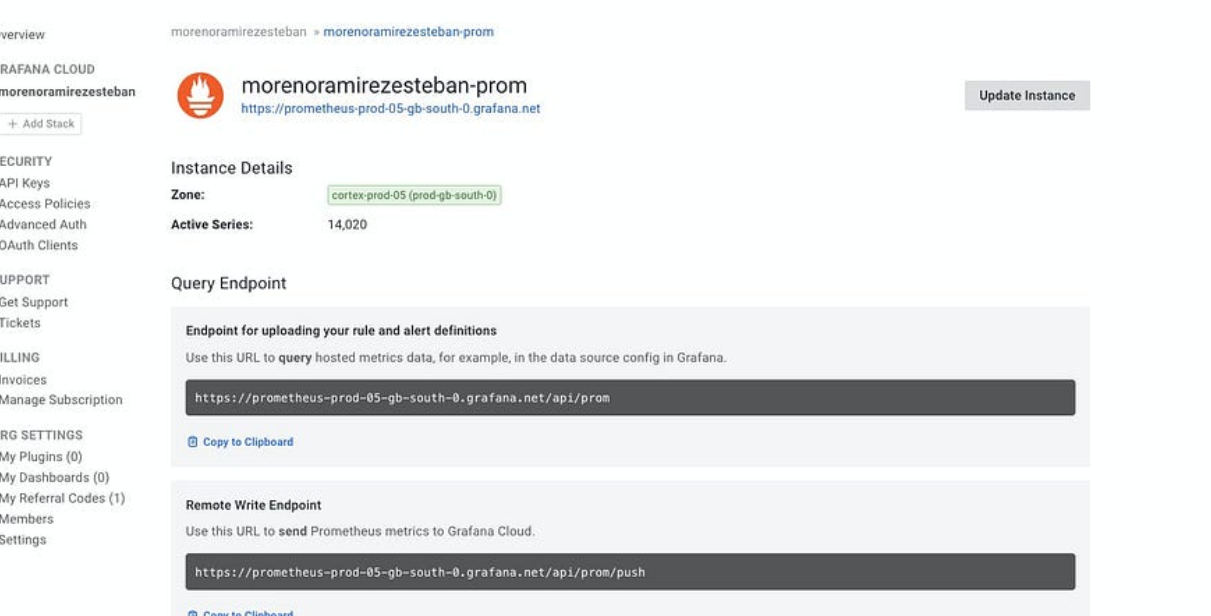
Access Your Grafana Cloud Dashboard: Once you've signed up, access your Grafana Cloud dashboard. This is where you'll configure your alerts and monitor your systems.
Navigate to Alerting Section: In your Grafana Cloud dashboard, navigate to the Alerting section. Here, you'll find all the tools you need to set up and manage your alerts.
Setting Up Sample Alerting
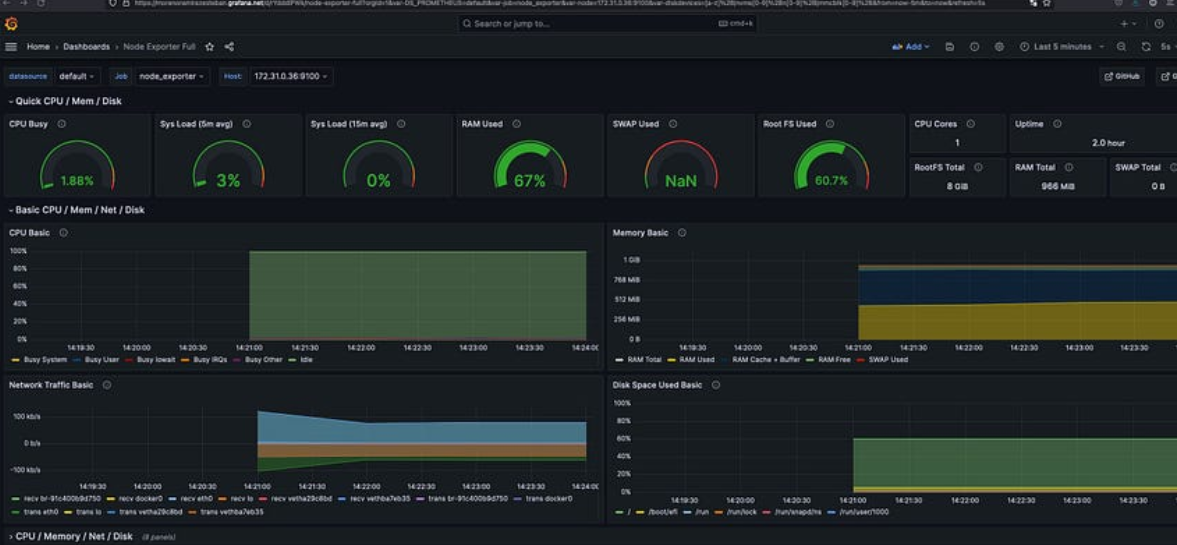
Define Alert Conditions: Identify the metrics or conditions that signify potential issues in your systems. For example, you might want to set an alert for CPU usage exceeding a certain threshold.
Create Alert Rules: Using Grafana's intuitive UI, create alert rules based on the conditions you've defined. Specify parameters such as thresholds, time intervals, and notification channels.
Configure Notification Channels: Decide how you want to be notified when an alert is triggered. Grafana supports various notification channels, including email, Slack, and PagerDuty. Configure these channels to ensure timely alerts reach the right people.
Test Your Alerts: Before deploying your alerts in a production environment, test them to ensure they're functioning as expected. Trigger test alerts and verify that notifications are received through your chosen channels.
Deploy and Monitor: Once you're satisfied with your alert configurations, deploy them to your production environment. Monitor your systems closely and fine-tune your alerts as needed to minimize false positives and ensure optimal performance.
By setting up Grafana Alerting, you're taking proactive steps to detect and address issues in your systems before they escalate. With real-time alerts and actionable insights, you can maintain the stability and reliability of your infrastructure effectively.
Stay tuned for more exciting adventures in the world of Grafana! 🌟 #Grafana #Alerting #DevOps #Monitoring #GrafanaCloud 🚀🔍


