Day 76 - Build a Grafana Dashboard 📊

Hey everyone! Today, we're diving into the exciting world of Grafana dashboards. Dashboards are like the command centers of your monitoring setup, offering a visual snapshot of your data and metrics. Let's roll up our sleeves and start crafting our own dashboard masterpiece! 💪
Task 01: Crafting Your First Panel
Configuring Loki and Promtail for Efficient Log Management
Step 1: Download Configuration Files
First things first, let's create a folder and download the necessary YAML configuration files for Loki and Promtail:
mkdir loki-promtail-config
cd loki-promtail-config

wget raw.githubusercontent.com/grafana/loki/v2.8..-O loki-config.yaml

wget raw.githubusercontent.com/grafana/loki/v2.8..-O promtail-config.yaml
Step 2: Run Loki Docker Container
Now, let's fire up the Loki Docker container using the following command:
docker run -d --name loki -v $(pwd):/mnt/config -p 3100:3100 grafana/loki:2.8.0 --config.file=/mnt/config/loki-config.yaml
Remember, we've mapped port 3100 to the Loki container for easy access.
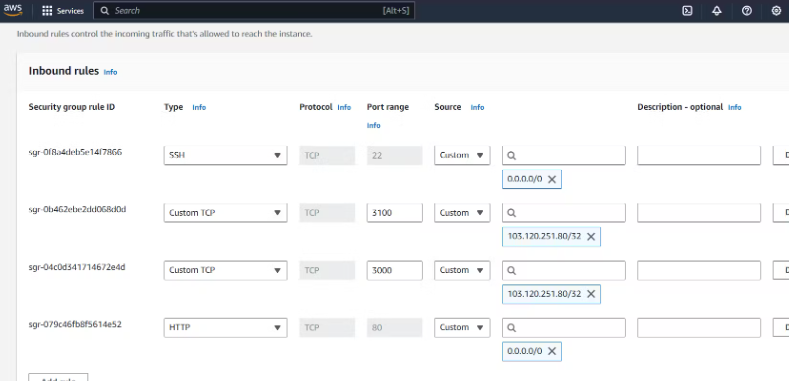
Step 3: Open Port in Security Group
Don't forget to open port 3100 in the security group to ensure smooth communication with the Loki container.
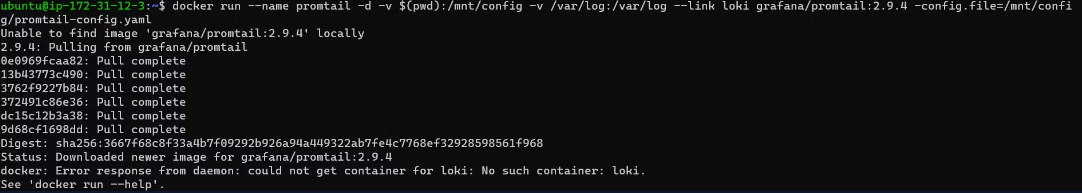
Step 4: Run Promtail Docker Container
Next up, let's start the Promtail Docker container to collect logs. Run the following command:
docker run -d --name promtail -v $(pwd):/mnt/config -v /var/log:/var/log --link loki grafana/promtail:2.8.0 --config.file=/mnt/config/promtail-config.yaml
This command links the Promtail container to Loki for efficient log streaming.
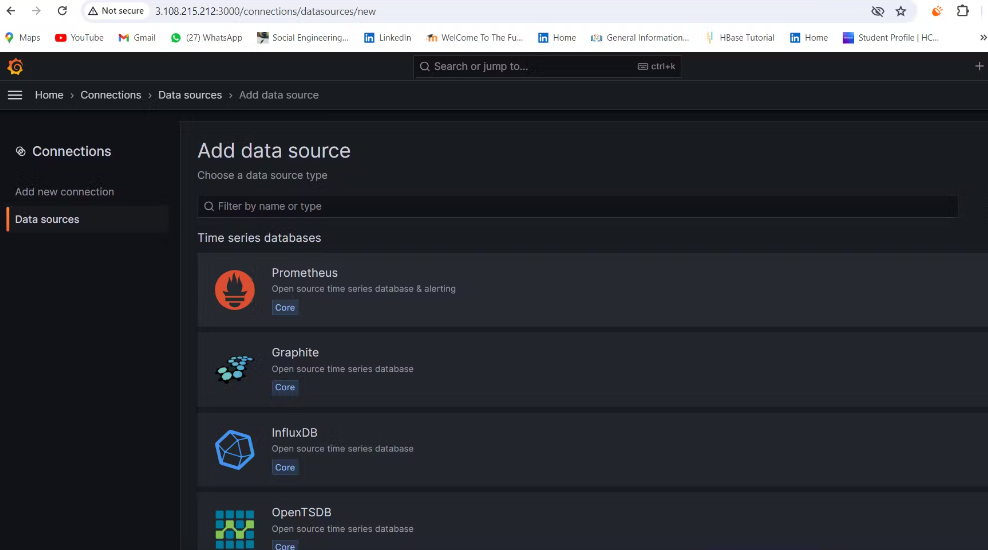
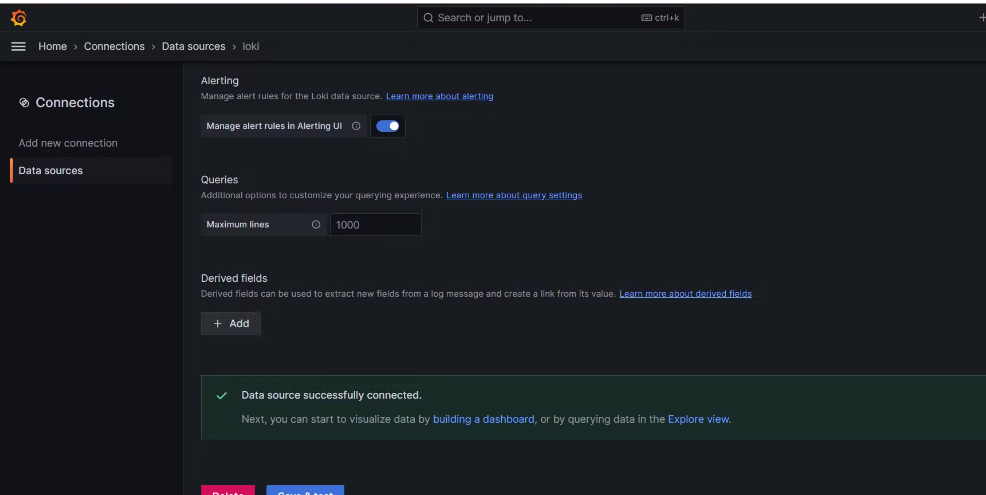
Step 5: Configure Data Source in Grafana
Head over to the Grafana webapp and add the Loki data source. Provide the HTTP URL localhost:3100 and save & test the connection.
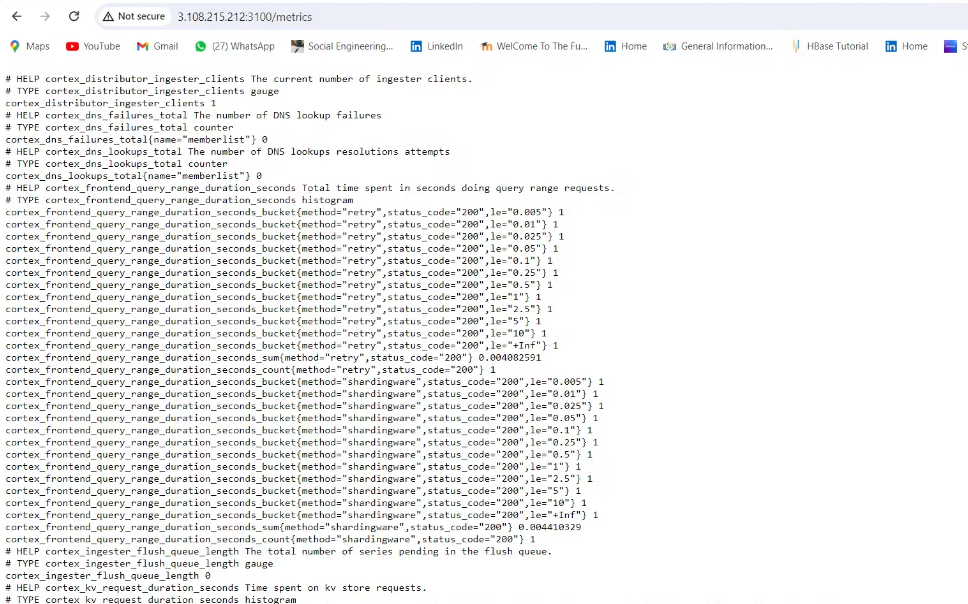
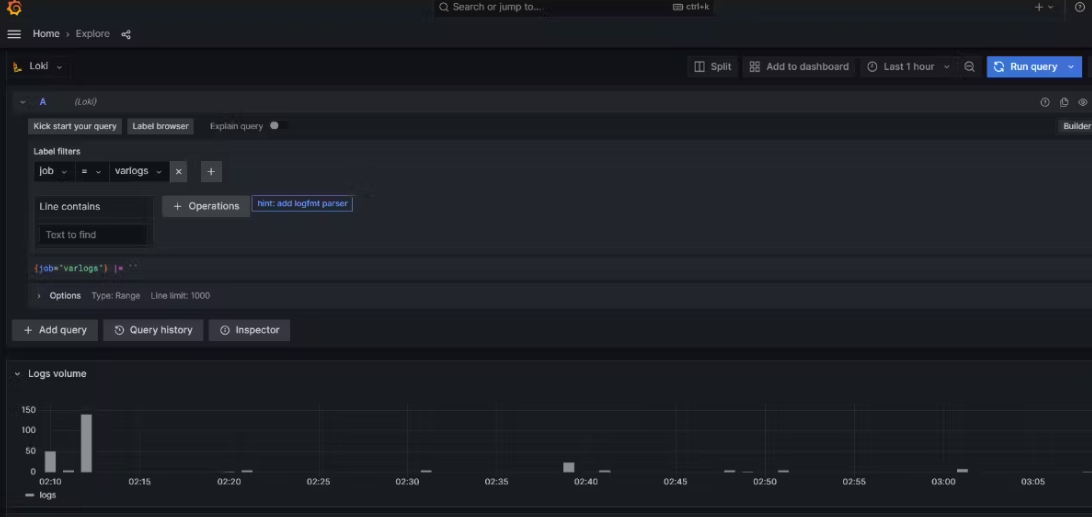
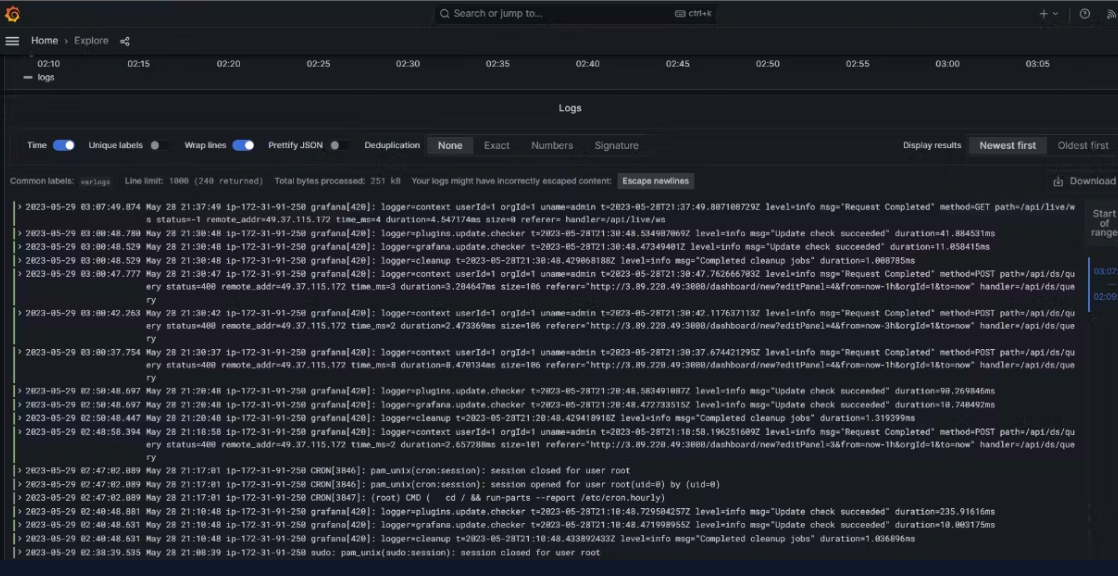
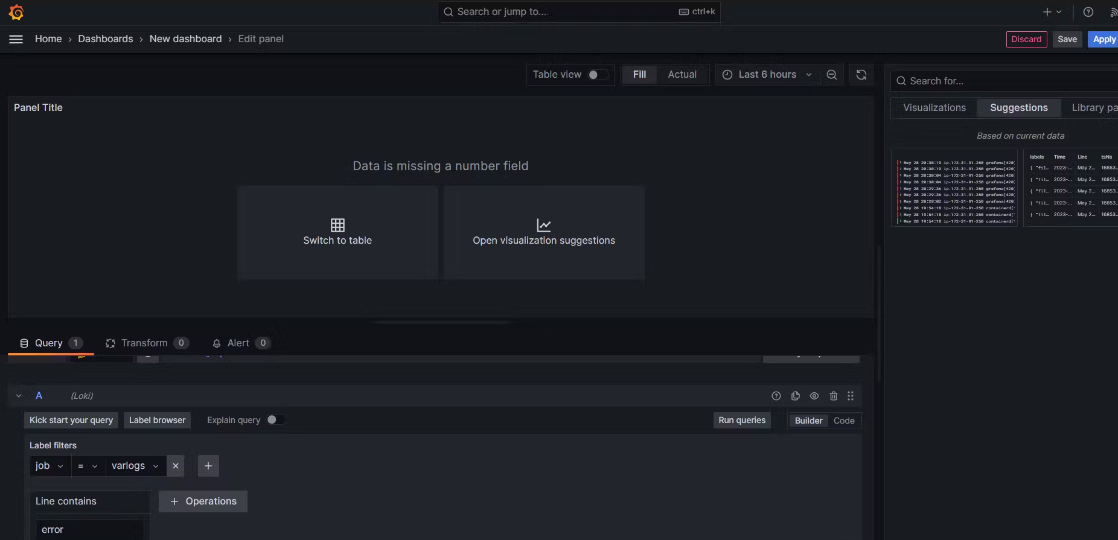
Step 6: Explore Logs in Loki
Navigate to the Explore section in Grafana to explore the logs collected by Loki. Set label filters for job and varlogs to view system logs efficiently.
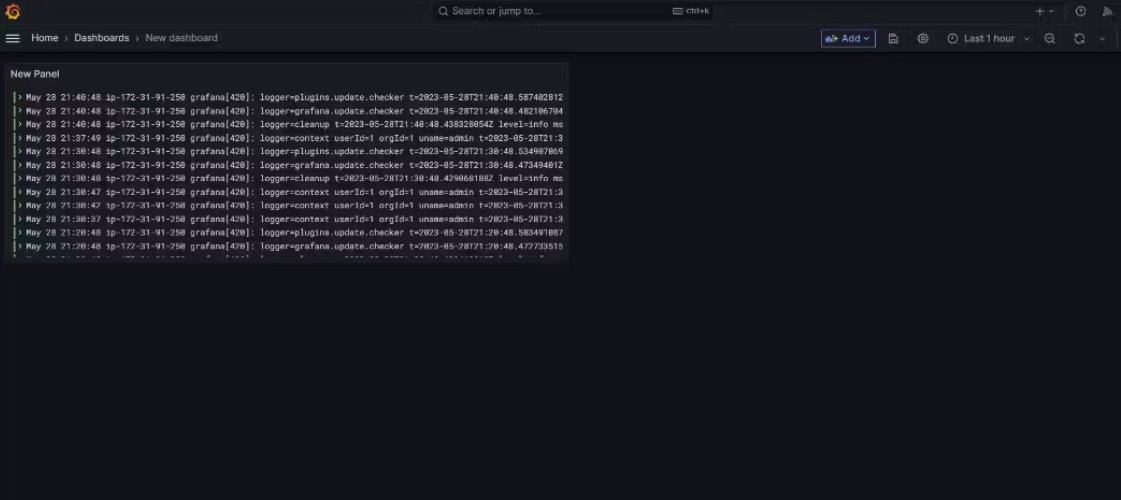
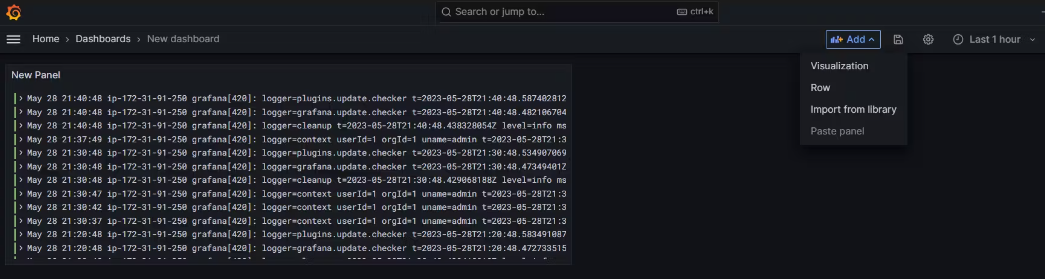
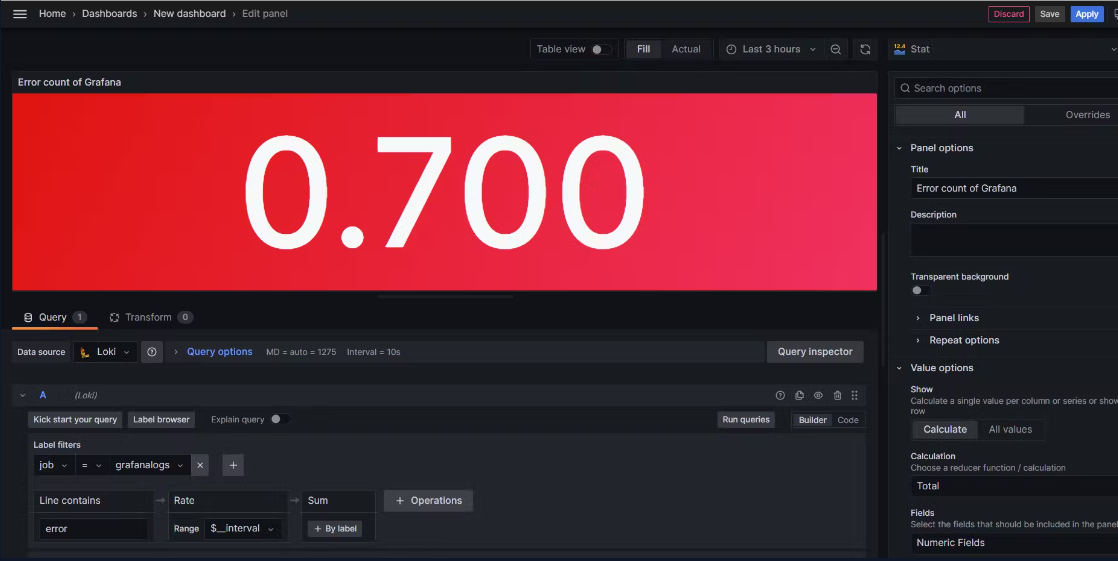
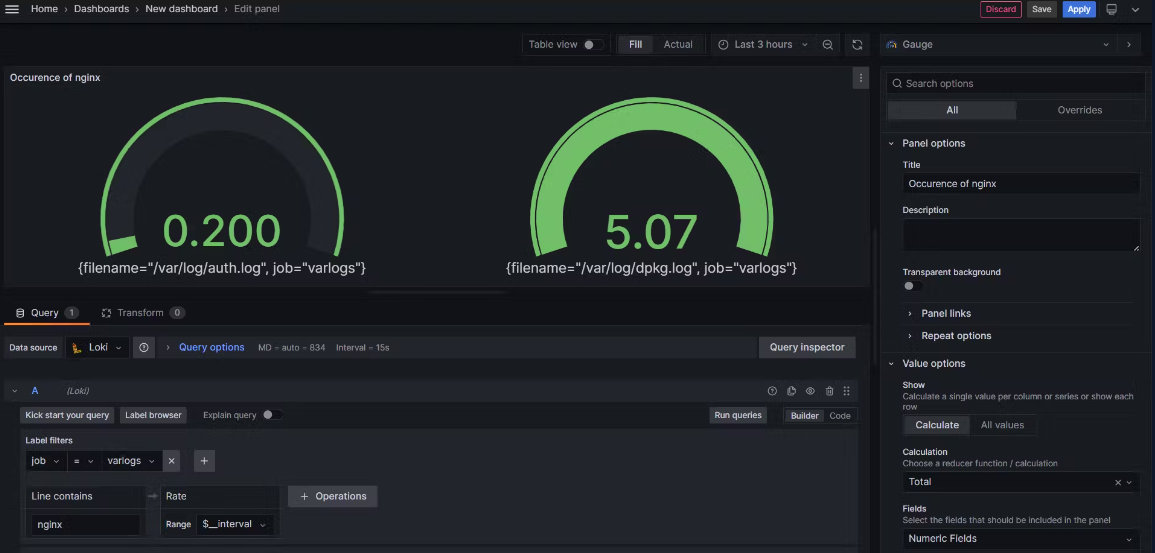
Step 7: Create Dashboard
Let's build a comprehensive dashboard in Grafana. Add logs and visualizations to monitor system performance and errors effectively.
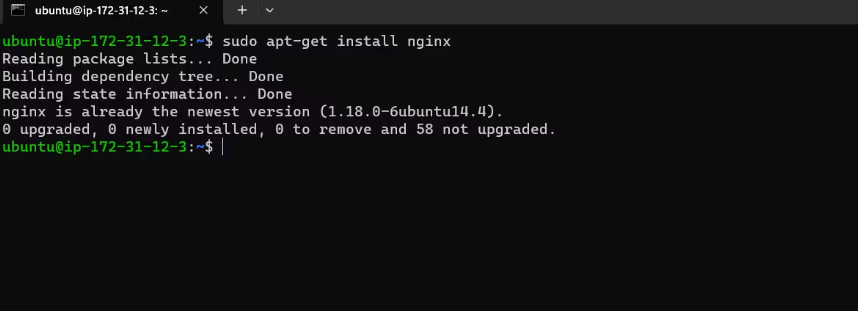
Step 8: Install Nginx and Monitor Installation Logs
For practical demonstration, install Nginx on your EC2 instance and use label filters to monitor installation logs.
Step 9: Enjoy Your Custom Dashboard
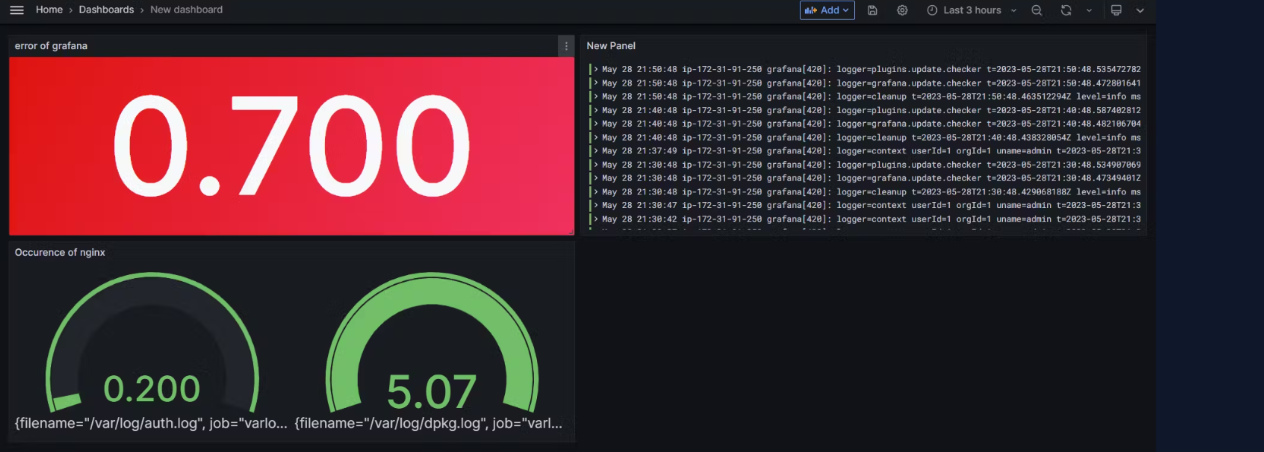
Voila! Now you have a fully functional Grafana dashboard showcasing logs and system metrics. Keep exploring and customizing to meet your monitoring needs! 💡 #Grafana #Loki #Promtail #LogManagement #DevOpsJourney 🛠️
Thank you for reading this Blog. Hope you learned something new today! If you found this blog helpful, please like, share, and follow me for more blog posts like this in the future.
You can connect with me at: https://www.linkedin.com/in/davendersingh/


