Day 75 - Sending Docker Log to Grafana 🐳

Welcome to another exciting day of our journey into the realm of Grafana! Today, we're taking things up a notch by integrating Docker logs into our Grafana dashboard, adding a new layer of insight and monitoring to our infrastructure.
Task:
Install Docker and Start Docker Service on a Linux EC2 Through User Data:
Begin by spinning up a Linux EC2 instance on AWS.
Utilize the User Data feature to automatically install Docker and start the Docker service upon instance launch.
User Data scripts can be as simple as installing Docker with
yumoraptpackage managers and starting the Docker service.
Create 2 Docker Containers and Run Any Basic Application:
Once Docker is up and running on your EC2 instance, create two Docker containers.
You can choose any basic application to run on these containers. For simplicity, a straightforward todo app with a simple frontend and backend would suffice.
Use Docker commands like
docker pull,docker run, anddocker-composeto set up your containers and deploy the applications.
Integrate Docker Containers and Share Real-Time Logs with Grafana:
Ensure that your EC2 instance is already connected to Grafana, and the Docker plugin is enabled on Grafana.
Utilize Docker logging drivers to route container logs to a destination where Grafana can access them. Common logging drivers include
json-file,syslog,journald, etc.Configure Docker to stream logs to a central logging system like Elasticsearch or Logstash, which can then be visualized in Grafana.
Check Logs or Docker Container Name on Grafana UI:
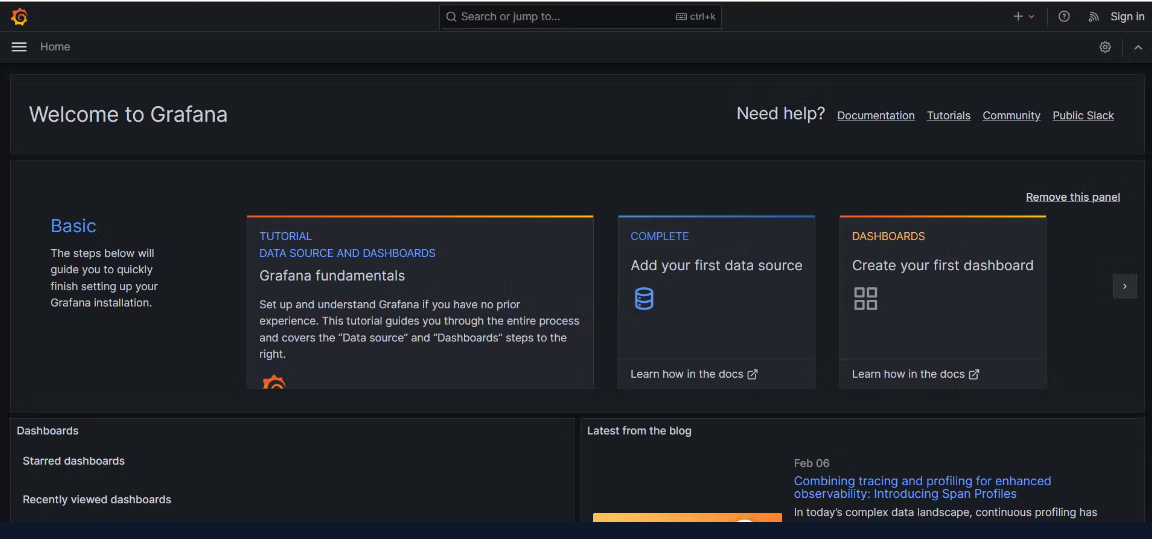
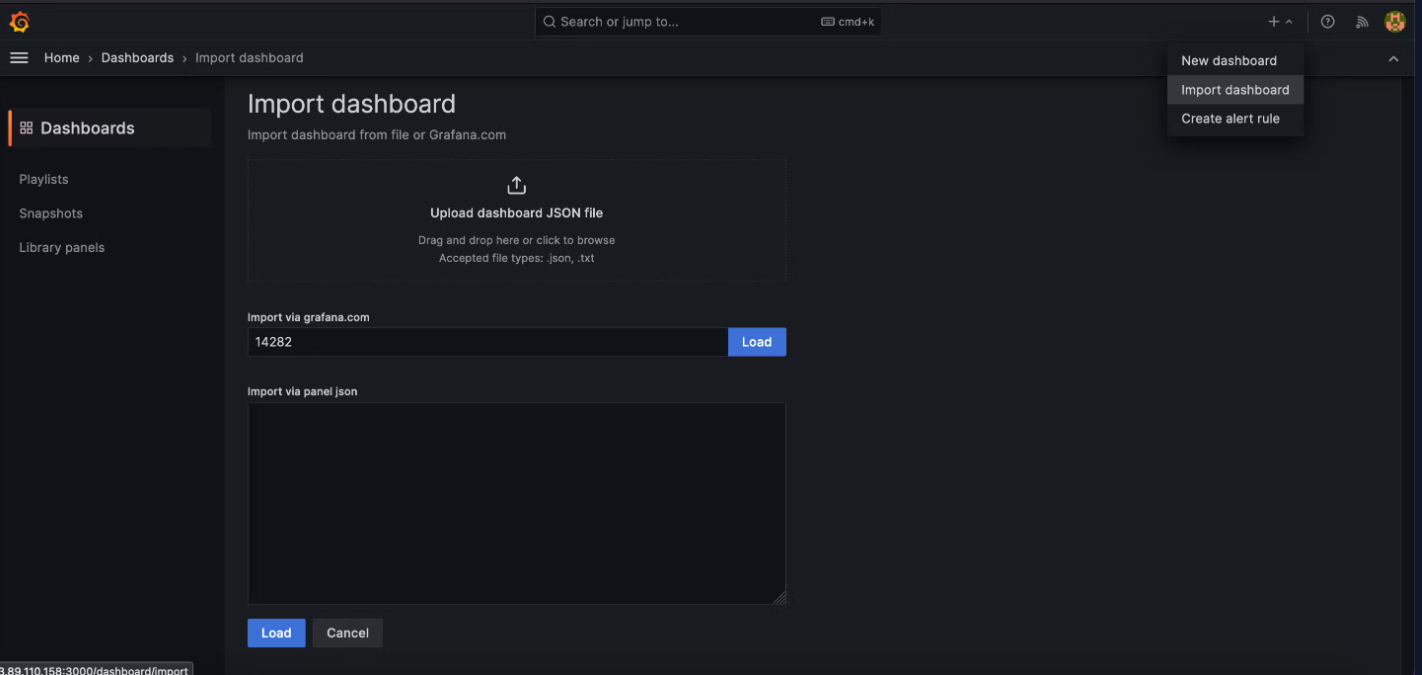
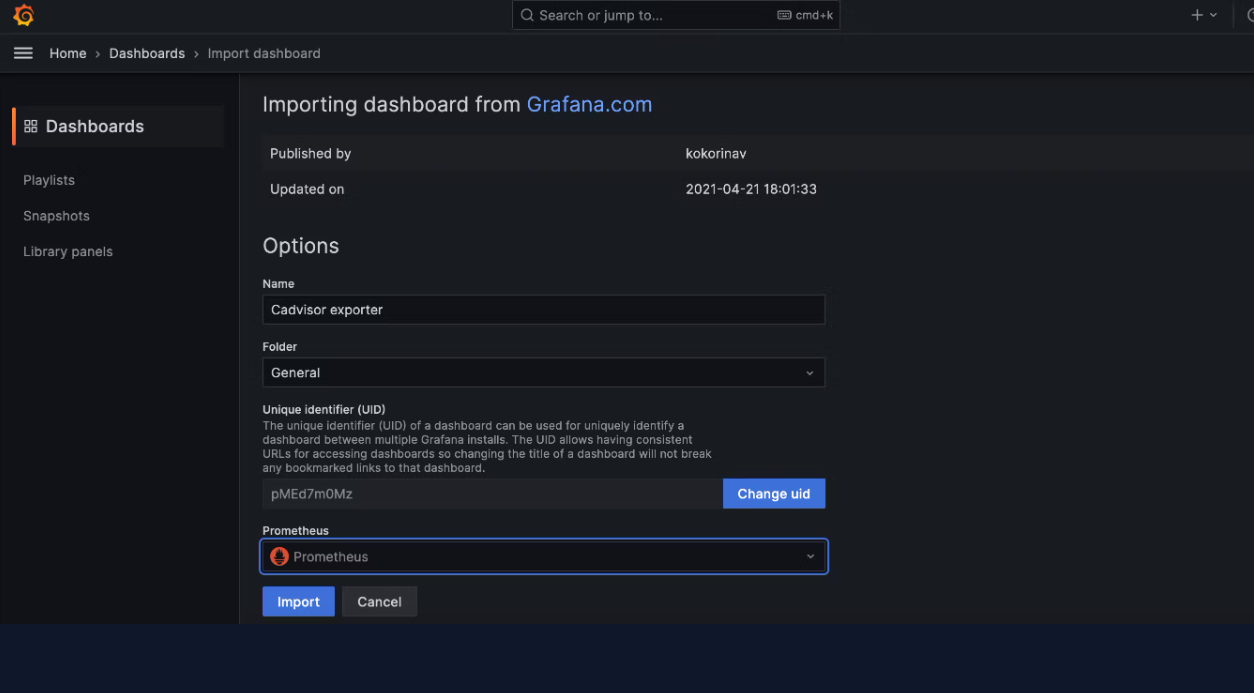
Once the Docker logs are being forwarded to Grafana, navigate to your Grafana dashboard.
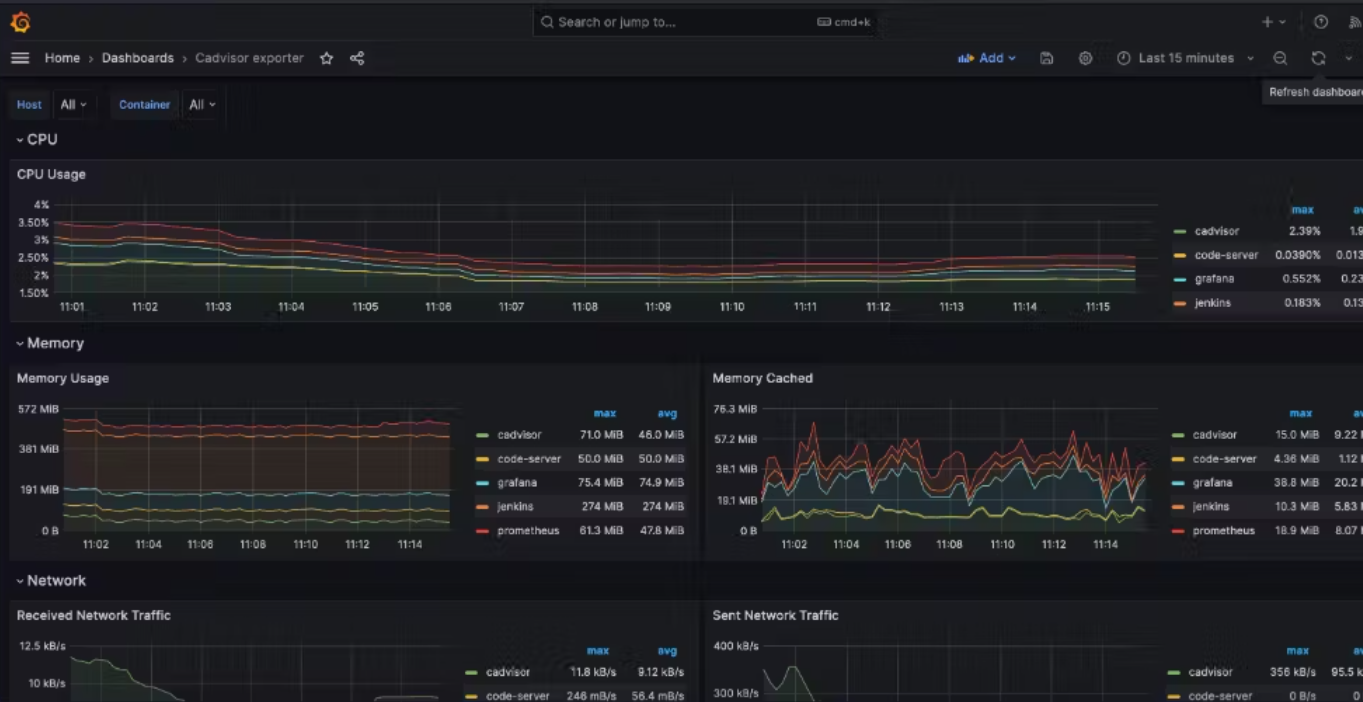
Create a new panel or visualization to display the real-time logs from your Docker containers.
You can use Grafana's querying and filtering capabilities to display specific logs based on container name, time range, etc.
By completing this task, you'll not only enhance your monitoring capabilities with Grafana but also add valuable skills and projects to your resume. Happy monitoring! 🚀 #Grafana #Docker #Monitoring #InfrastructureAsCode #TechSkills
Thank you for reading this Blog. Hope you learned something new today! If you found this blog helpful, please like, share, and follow me for more blog posts like this in the future.
You can connect with me at: https://www.linkedin.com/in/davendersingh/


