Day 74 - Connecting EC2 with Grafana

Welcome back, fellow tech explorers! Yesterday, we embarked on our Grafana journey by setting up this powerful monitoring tool on our local machines. Today, we're taking our skills to the next level by connecting both a Linux and a Windows EC2 instance to Grafana for comprehensive server monitoring. Let's dive right in!
Step 1: Launching EC2 Instances
First things first, we need our EC2 instances up and running. Head over to the AWS Management Console and launch one Linux and one Windows EC2 instance. Make sure to select appropriate instance types based on your requirements.
Step 2: Installing Grafana
If you haven't already set up Grafana on your local environment, refer to the instructions from Day 73's blog post to install Grafana on an EC2 instance. Remember to open necessary ports in the security group to allow access to Grafana.
Step 3: Configuring Data Sources
Once Grafana is installed, log in to the Grafana dashboard using your credentials. Navigate to the "Configuration" section and click on "Data Sources." Here, we'll add the necessary data sources for our Linux and Windows servers.
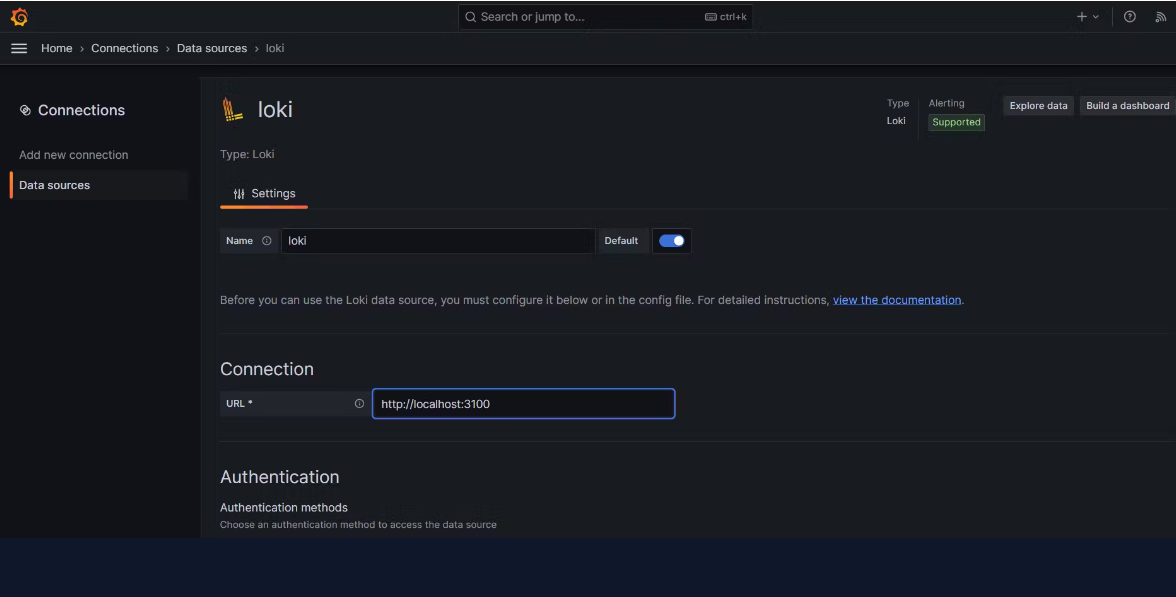
For the Linux server, select "Prometheus" as the data source type and provide the appropriate endpoint URL. For the Windows server, we'll use "WMI Exporter" as the data source type. Configure the endpoint URL accordingly.
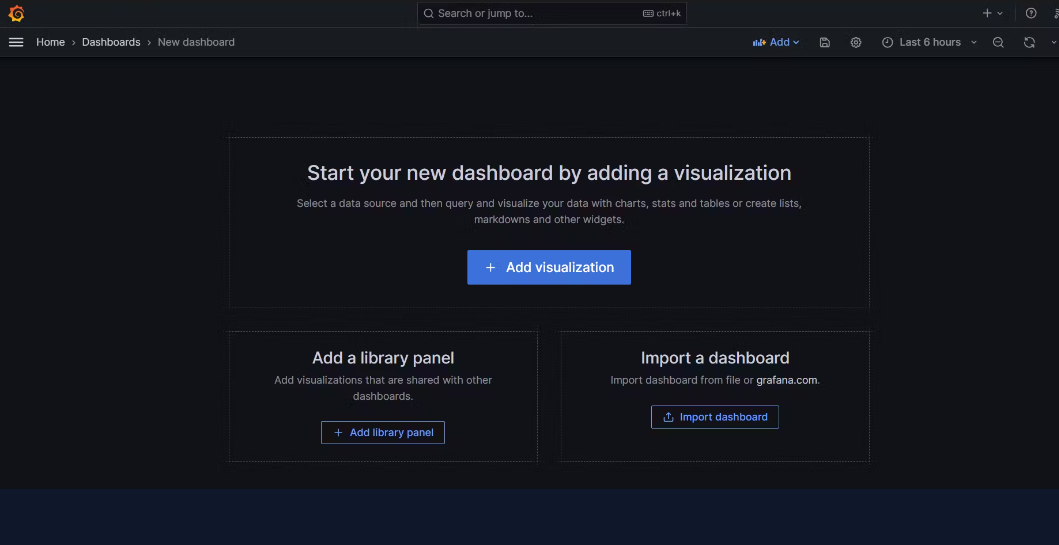
Step 4: Setting up Dashboards
Now comes the fun part - creating dashboards! Head over to the "Dashboards" section in Grafana and click on "Create Dashboard." Here, you can customize your dashboard to display various metrics and visualizations for both the Linux and Windows servers.
For the Linux server, you might want to monitor CPU usage, memory utilization, disk space, network traffic, etc. Similarly, for the Windows server, consider metrics like CPU usage, RAM utilization, disk performance, etc.
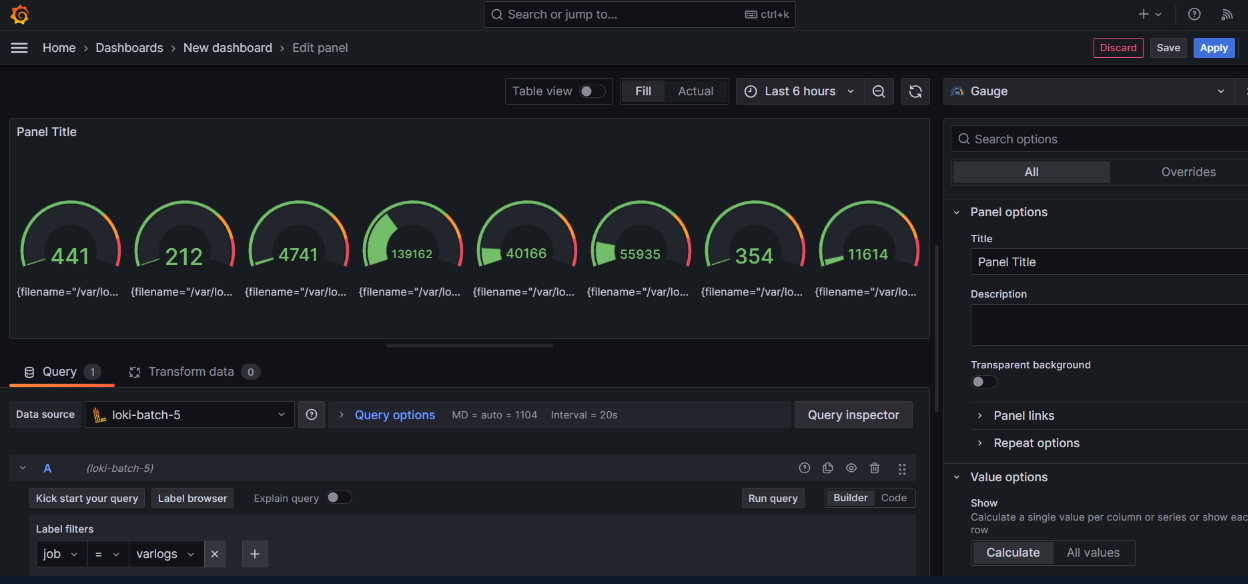
Step 5: Adding Panels
Within each dashboard, you can add panels to visualize specific metrics. Grafana offers a wide range of visualization options, including graphs, gauges, histograms, and more. Choose the appropriate visualization type for each metric you want to monitor and configure the panel settings accordingly.
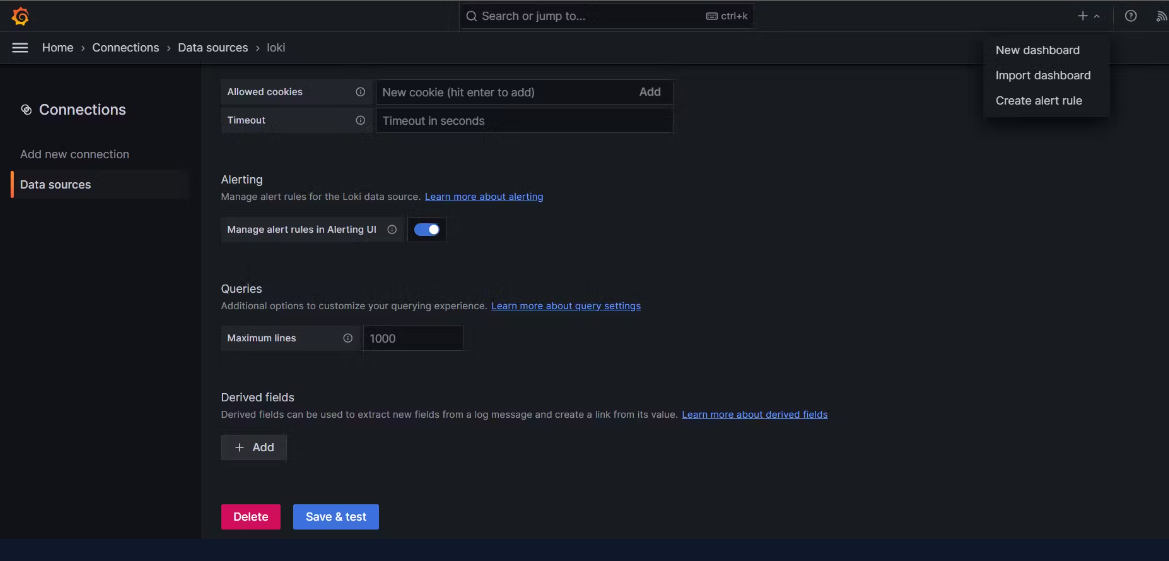
Step 6: Configuring Alerts (Optional)
To stay proactive in server monitoring, you can set up alerts in Grafana to notify you when certain metrics exceed predefined thresholds. This ensures that you're immediately alerted to any potential issues with your servers, allowing you to take timely action.
Step 7: Testing and Optimization
Once your dashboards and panels are set up, it's time to test them out! Monitor the metrics in real-time and make any necessary adjustments to optimize the dashboards for better visibility and usability.
Step 8: Documentation and Knowledge Sharing
Lastly, document your setup and share your knowledge with your team or the community. Create documentation detailing the steps you followed to connect EC2 instances with Grafana, including any configurations or customizations made along the way. This not only reinforces your own understanding but also helps others learn from your experience.
Congratulations on successfully connecting your Linux and Windows EC2 instances with Grafana! You're now equipped with powerful monitoring capabilities to keep a close eye on your server infrastructure. Keep exploring, learning, and pushing the boundaries of what you can achieve with Grafana! 🔍📈 #Grafana #EC2 #ServerMonitoring #DataVisualization #TechJourney
Thank you for reading this Blog. Hope you learned something new today! If you found this blog helpful, please like, share, and follow me for more blog posts like this in the future.
You can connect with me at: https://www.linkedin.com/in/davendersingh/


